Food production accounts for one-quarter of the world’s greenhouse gas emissions and takes up half of the planet’s habitable surface.
A taste for meat has had a particular impact on land. The mass of animals raised for slaughter on Earth now outweighs wildlife by a factor of 15-to-1. For example, for every person on the planet, there are approximately three chickens.
Meat and dairy specifically accounts for around 14.5% of global greenhouse gas emissions, according to the UN’s Food and Agricultural Organization (FAO).
If the world is to meet its target of limiting global warming to “well below” 2C, some degree of diet shift will be necessary, scientists say. If it is to strive for the most optimistic target of keeping warming to 1.5C, changes to diet may be even more crucial.
In this interactive Q&A, Carbon Brief explores how greenhouse gas emissions from meat, dairy and other diets compare, as well as whether changes to the production and transportation of meat could help to stem its climate impact.
How do emissions from meat, dairy and other foods compare?
There are several ways to assess the relative climate impact of different food groups. The chart below compares the average greenhouse gas emissions produced per kilogram of different food products.
The analysis, which is based on a study published in Science in 2018, considers all the factors that go into producing food, including the land required for production, the farming process and the transportation and selling stages. (The emissions from each of these stages are discussed in more detail below.)
Greenhouse gas emissions per kilogram for different food groups. Adapted from Dr Hannah Ritchie/Our World in Data (2020) Data source: Poore & Nemecek (2018). Chart by Carbon Brief using Highcharts.
The chart illustrates how the climate impact of beef and lamb dwarfs that of other foods. This is partly down to the biology of how these animals digest food, explains Prof Sir Charles Godfray, a population biologist and head of the Oxford Martin School at the University of Oxford. He tells Carbon Brief:
However, the chart illustrates that producing beef is more than twice as carbon intensive as producing lamb.
One reason for this is that cows take longer to grow and reproduce, meaning the production of beef requires much more feed and land than other types of meat.
The conversion of land for beef production and animal feed is a leading cause of deforestation in many tropical regions, including in the Amazon, where a recent spike in forest fires and clearing has been linked to cattle ranching. Prof Walter Willett, a leading nutritionist at the public health school of Harvard University, tells Carbon Brief:
The cutting down of tropical forest causes the release of long-held stores of carbon. (Tropical deforestation as a whole accounts for around 8% of global greenhouse gas emissions.)
Grazing cattle need plentiful supplies of grass – meaning farmers often use nitrogen fertiliser on their fields to stimulate plant growth. The production of nitrogen fertiliser causes the release of CO2 and the potent greenhouse gas nitrous oxide (N2O).
(It is worth noting that emissions from beef can vary greatly. See: Do farming and production conditions affect meat and dairy emissions?)
The resource-intensive nature of cattle rearing also explains why, on average, cheese and other dairy products have a higher climate cost than pork and poultry. Also, chickens and pigs are not ruminants and so do not produce as much methane.
The chart also shows that, on average, farmed prawns have a larger climate impact than other types of seafood.
This is partly due to the fact that some parts of southeast Asia have seen a boom in “industrial-scale” aquaculture.
In these systems, prawns are fed with high amounts of fish feed, much of which is wasted and taken up by other marine microorganisms which then release methane into the atmosphere. Aquaculture also often requires carbon-rich mangroves to be cut down, which causes large amounts of CO2 to be released.
In comparison to meat and dairy, plant-based foods have much smaller carbon footprints. On average, emissions from plant-based foods are 10 to 50 times smaller than those from animal products, according to the Science study.
Notable exceptions on the chart above include coffee and chocolate. Coffee is mostly grown in tropical regions and its production often involves using high amounts of nitrogen fertilisers, which mostly explains why it has a larger climate impact by kilogram than other plant-based foods. Chocolate’s climate impact is mostly caused by the land-use change required to produce cocoa.
However, it is worth noting that both coffee and chocolate do not contribute much to nutrition, says Dr Hannah Ritchie, a senior researcher at the Oxford Martin School and head of research at Our World in Data. Ritchie, who conducted the analysis behind the chart above, tells Carbon Brief:
“One thing to be conscious of when comparing these products is serving size. Many are shocked by coffee’s footprint – and that’s not to say that coffee doesn’t have a reasonably high footprint – but that the serving size is typically smaller.”
The chart below shows the average greenhouse gas emissions for different food products per 100g of protein, rather than for weight alone.
This chart shows that, when protein is considered rather than mass, dark chocolate has the highest footprint. (However, it is worth noting that chocolate typically contains a very small amount of protein in comparison to animal products such as beef and lamb – and therefore a consumer would need to eat much more of it to derive the same amount.)
Greenhouse gas emissions per 100g of protein for different food groups. Adapted from Dr Hannah Ritchie/Our World in Data (2020) Data source: Poore & Nemecek (2018). Chart by Carbon Brief using Highcharts.
Can switching to vegetarian, vegan or other diets help to reduce emissions?
Given that the climate impact of plant-based foods is typically 10 to 50 times smaller than that of animal products, it follows that switching from a largely meat-based diet to a vegetarian or vegan diet could help to reduce emissions.
The chart below shows how much greenhouse gases could be stemmed if the world were to adopt various different diets.
Greenhouse gas savings potential from the global adoption of various diets. Error bars show the spread of results from different studies. Data without error bars are from one study only. Adapted from IPCC (2018). Chart by Carbon Brief using Highcharts.
The analysis comes from a report by the Intergovernmental Panel on Climate Change (IPCC), an independent research group made up of the world’s leading climate scientists. The report defines the different diets referenced in the chart above as follows:
- Vegan: a completely plant-based diet.
- Vegetarian: a diet of grains, vegetables, fruits, sugars, oils, eggs and dairy and around one serving of meat or seafood per month.
- Flexitarian: a diet in which 75% of meat and dairy is replaced by cereals and pulses. (This includes at least 500g of fruit and vegetables and at least 100g of plant-based protein per day – and no more than one portion of red meat a week.)
- Healthy diet: a diet based on global dietary guidelines, which involves eating less meat and more fruit and vegetables.
- Fair and frugal: a diet assuming food is shared equally across the world with each person consuming 2800 calories a day. (This involves a relatively low level of animal products.)
- Pescetarian: a vegetarian diet that includes seafood.
- Climate carnivore: a diet where 75% of red meat is replaced with other meat.
- Mediterranean: a diet of vegetables, fruits, grains, sugars, oils, eggs, dairy, seafood and moderate amounts of poultry, pork, lamb and beef.
In the IPCC’s special report on climate change and land, the team of scientists analysed recently published scientific papers that look into how these different diets could help to stem greenhouse emissions.
The chart above displays the total amount of greenhouse gases that could be saved each year by 2050 if the world were to adopt each of these diets, when compared to a “business-as-usual” scenario for 2050. (The “business-as-usual” scenario is based on projections of continued population growth and rising meat intake from the FAO.)
(The chart shows the savings in terms of millions of tonnes of CO2 equivalent [CO2e] – a measure used to compare the emissions from various greenhouse gases.)
Savings come both from ridding the world of the greenhouse emissions associated with livestock production (see: How do emissions from meat, dairy and other foods compare?) and also from sparing land that would otherwise be needed for livestock rearing.
The analysis shows that a global switch to veganism would deliver the largest emissions savings out of any dietary shift.
According to the analysis, a switch to veganism could save almost 8bn tonnes of CO2e a year by 2050, when compared to a “business-as-usual” scenario. (By comparison, all food production currently causes around 13.7bn tonnes of CO2e a year.)
The steep reduction in emissions would partially stem from the freeing up of large amounts of land, which could be used to plant forests capable of removing CO2 from the atmosphere, the IPCC authors say:
(Separate research finds that the emissions savings from a global switch to veganism could actually be as high as 14.7bn tonnes of CO2e a year.)
The second highest emissions savings would be delivered by a global shift to vegetarianism which, in the analysis, still includes around one serving of meat or fish a month. An adoption of this diet could save 6bn tonnes of CO2e a year by 2050, according to the analysis.
Following this is a shift to “flexitarianism” – a diet where three-quarters of meat and dairy is replaced by plant-based alternatives. A global shift to this diet could save just over 5bn tonnes of CO2e a year by 2050, the analysis says.
It is worth noting that, while veganism offers large emissions savings when compared to a “business-as-usual” scenario, the additional benefits become smaller when compared to vegetarianism and flexitarianism, says Willett:
The analysis also shows that a global shift to “healthy” eating could offset around 4.5bn tonnes of CO2e a year by 2050.
In addition, the majority of national healthy eating guidelines recommend that their citizens eat less meat and more fruits and vegetables. (For example, Public Health England’s Eatwell Guide suggests the average Briton should eat less red and processed meat and consider choosing low-fat alternatives to dairy.)
A study published in 2016 found a global shift towards more plant-based diets that are in line with standard dietary guidelines could reduce global mortality by 6-10% by 2050 in addition to reducing emissions by 29-70%, when compared to a business-as-usual scenario.
How does meat and dairy consumption vary around the world?
A global shift towards a more plant-based diet would help to reduce emissions, but it is worth bearing in mind that every country in the world eats differently.
A country’s diet – and its resulting food emissions – can be based on many factors, including its cultural and religious beliefs, geography and economic status.
In 2019, a group of leading food and climate scientists came together to analyse how different countries around the world eat – and how this might need to change if the world is to reduce the climate impact of food. Willett, who led the project, which is known as the EAT-Lancet Commission, tells Carbon Brief:
For the first part of their analysis, the commission analysed the scientific literature in order to come up with a universal diet that would be healthy and sustainable for all.
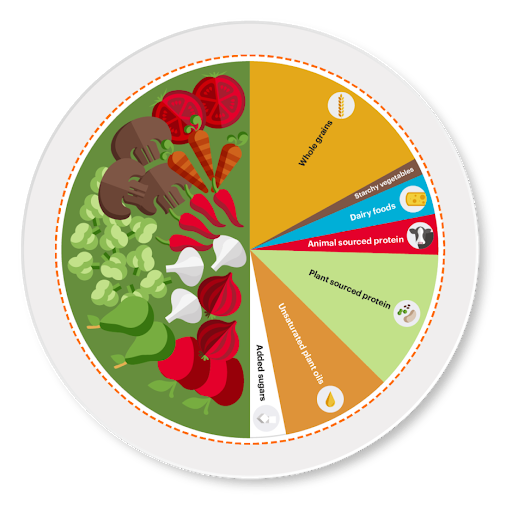
The “planetary health diet”. Credit: The EAT-Lancet Commission (2019).
The “planetary health diet” – illustrated above – is around half fruit and vegetables, with whole grains, unsaturated plant oils and plant-sourced proteins also playing a large role.
The diet allows for around one portion of dairy a day and around one serving of meat a week, says Willett:
For the second part of their analysis, they assessed how the dietary habits of different parts of the world would need to change to fit with their proposed planetary diet.
[…]
Is it better to ‘eat local’?
Advocates for meat-eating often argue that consumers can evade the environmental consequences by choosing products made in their country of origin. It is argued that “local meat” has not had to travel by plane or ship before it arrives on the plate and, therefore, must be more environmentally friendly than other foods from further away.
However, research shows that the contribution of “food miles” is relatively small in comparison to other factors, such as production, explains Godfray:
“Food miles make a difference, but they tend to be relatively small compared with the other inputs. They are not completely negligible, but it is easy to overestimate food miles.”
The chart below shows how much travel emissions contribute, on average, to the total greenhouse gas emissions per kilogram of different foods.
The contribution of transport to total greenhouse gas emissions per kilogram for different food groups. Adapted from Dr Hannah Ritchie/Our World in Data (2020). Data source: Poore & Nemecek (2018). Chart by Carbon Brief using Highcharts.
The chart demonstrates how just a small fraction of food emissions come from transport and that, in general, total emissions are more influenced by food type (animal-based or plant-based).
The reason why transport emissions are relatively low is that most food is transported by shipping or rail, says Willett:
The chart below gives a breakdown of how food is transported. (The metric – “food miles” – is calculated as the distance each transport method covers multiplied by the quantity of food transported by mass.)
Global food miles by transport method. Adapted from Dr Hannah Ritchie/Our World in Data (2020). Chart by Carbon Brief using Highcharts.
Food miles do make a difference to total emissions for the small fraction of products that are transported via air, Ritchie says in her analysis:
This is because air travel is particularly polluting and also unable to deliver large quantities of food, making it relatively inefficient.
Products that are air freighted tend to be those that perish quickly, including some fresh fruit and vegetables, says Prof Sarah Bridle, a cosmologist and food scientist at the University of Manchester. She tells Carbon Brief:
An analysis by the Greenhouse Gas and Dietary choices Open source Toolkit (GGDOT) – an initiative led by Bridle – found that, in the UK, air-freighted asparagus has a carbon footprint that is around six times higher than locally-produced asparagus.
It is also worth bearing in mind that some locally reared meat can have a “hidden transport cost”, says Willett. This can be the case when animals are fed on grain imported from other countries, he says.
A study published in 2016 found that more than half of the UK’s animal feed is imported – mostly from South America and the European Union.
Imported animal feed can have an even larger climate impact when it is linked to deforestation in tropical regions. A study published this year estimated that up to one fifth of the Brazillian soy that is exported to the European Union is linked to illegal deforestation. (Soy is commonly used to feed livestock.)
Do farming and production conditions affect meat and dairy emissions?
Another common claim by meat advocates is that, under the right farming conditions, livestock rearing can have a minimal – or even beneficial – impact on the climate.
It is true that emissions from livestock production vary from country to country and from farm to farm, says Dr Tara Garnett, leader of the Food Climate Research Network and researcher at the University of Oxford. She tells Carbon Brief:
Emissions from production depend on a number of factors, including how much and what type of land has been converted, the type and amount of fertilisers used, animal welfare and upkeep – to name a few.
One factor that can influence total emissions is the type of feed given to cattle, says Bridle:
However, even when the range of different production systems are considered, emissions from meat and dairy products still tend to be larger than those from plant-based foods, Ritchie says in her analysis:
The visualisation below shows the spread of greenhouse gas emissions (per 100g of protein) created by the production of different foods.
Based on a study published in Science 2018, it draws on production emissions data from more than 38,000 commercial farms in 119 countries. On the chart, the height of the curve represents the amount of production globally with that specific footprint.
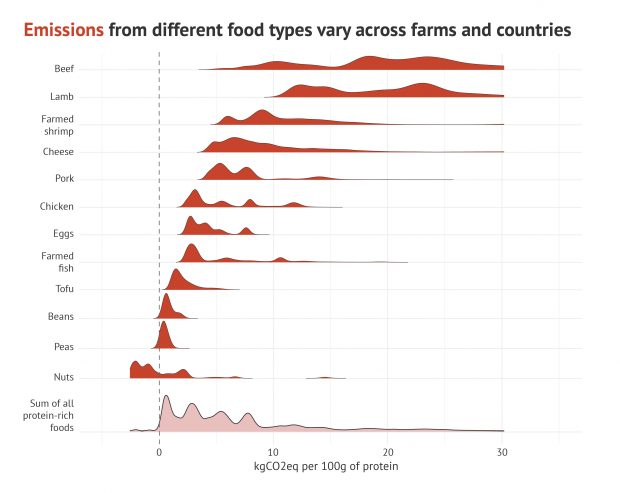
The spread of greenhouse gas emissions (per 100g of protein) created by the production of different food types from 38,000 farms. Adapted from Dr Hannah Ritchie/Our World in Data (2020) Data source: Poore & Nemecek (2018)
The visualisation shows that, on average, beef and lamb production have the highest carbon footprints of all the foods. However, the lowest-emitting beef has a carbon footprint that is a similar size to the average 100g-portion of chicken or eggs.
The lowest-emitting beef tends to come from the dairy sector, says Ritchie. Beef from dairy farms has a footprint that is around 60% lower than that of dedicated beef herds. (This is largely because dairy production systems tend to be more efficient.)
It is sometimes claimed that rearing cattle on grasslands can stimulate soil to uptake more carbon, helping to reduce climate change.
However, an analysis by the Food Climate Research Network in 2017 found that grass-fed cows release more greenhouse gas emissions through belching and manure than they are able to offset through boosting soil carbon levels.
This means that grass-fed beef is still a net contributor to climate change, says Garnett, who led the analysis.
The analysis also shows that production emissions from farmed shrimp and fish vary widely, with a small proportion of producers exhibiting very high emissions. The highest emissions come from “industrial-scale” aquaculture, which is popular in some parts of Asia.
The range of emissions for pork, chicken and egg production are smaller than for beef and lamb. This is because intensive systems for the production of these foods do not tend to differ much from region to region, says Ritchie.
The visualisation also shows that, for some plant-based foods, production emissions can be below zero. This means that the production of these foods removes CO2 from the atmosphere.
This is particularly true for nuts because some nut trees can be incorporated onto agricultural land – increasing its uptake of CO2, says Ritchie.
Do ‘plant-based’ meat and dairy alternatives have a lower climate impact?
From “bleeding” vegan burgers to oat milk, plant-based alternatives to meat and dairy have seen a huge surge in popularity in North America and Europe.
It is too early to say how these products could affect future food emissions, but they have broadened the choices available for those looking to reduce their meat consumption, says Willett:
The chart below compares the average greenhouse gas emissions created from a kilogram of beef and two plant-based alternatives, including the Beyond Burger and the Impossible burger. (It is worth noting that emissions from beef can vary greatly. See: Do farming and production conditions affect meat and dairy emissions?)
The data comes from several “life cycle assessments”, which consider the emissions created from every stage of production, from farming to processing and transportation.
Average greenhouse gas emissions per kilogram for beef, Beyond Burger’s beef alternative and Impossible’s beef alternative. Data sources: Poore & Nemecek (2018); Heller & Keoleian (2018); Khan et al. (2019). Chart by Carbon Brief using Highcharts.
The chart shows that the carbon footprints of both the Beyond Burger and the Impossible burger are around 20 times smaller than that produced by the same amount of beef.
The difference in emissions stem mainly from production.
The Beyond Burger is made from pea protein, while the Impossible burger is made from soy and potato protein. (Both products also contain high amounts of vegetable oils and fats.) The cultivation of these vegetables produces relatively fewer emissions than beef (see: How do emissions from meat, dairy and other foods compare?).
It is worth noting, however, that plant-based burgers do not deliver additional health benefits when compared to meat, says Willett:
The chart below shows the greenhouse gas emissions created from one glass (200ml) of dairy milk and various plant-based alternatives.
Average greenhouse gas emissions per 200ml for dairy, rice, soy, oat and almond milk. Data source: Poore & Nemecek (2018). Additional calculations for oat, almond and rice milk from Joseph Poore. Chart by Carbon Brief using Highcharts.
The chart shows how average emissions from plant-based milk are around half that of dairy milk. Again, this is largely down to differences in production emissions, says Bridle:
The chart shows that almond milk has the smallest carbon footprint. However, the production of almond milk requires large amounts of water. (In California, where 80% of the world’s almonds are produced, it has also been linked to unsustainable pesticide use.)
The plant-alternative with the second smallest footprint is oat milk. Oat milk also has small land-use impacts and water requirements, when compared to other milks, according to Poore’s analysis.
Dr Tara Garnett was interviewed by Josh Gabbatiss.
Words by Daisy Dunne. Design by Tom Prater and Joe Goodman.
September 14, 2020
Originally published on Carbon Brief.org licensed under a CC license
-

By: Carbon Brief
Carbon Brief (CB) is a UK-based website covering the latest developments in climate science, climate policy and energy policy. CB specialise in clear, data-driven articles and graphics to help improve the understanding of climate change, both in terms of the science and the policy response. CB publish a wide range of content, including science explainers, interviews, analysis and factchecks, as well as daily and weekly email summaries of newspaper and online coverage.
In 2018, Carbon Brief won the “energy and commodities” category of the Press Gazette’s British Journalism Awards for Specialist Media. It was a finalist in the “science and health” category. Separately, the Royal Statistical Society “highly commended” Carbon Brief in 2018 for its investigative journalism. In 2017, Carbon Brief won the “Best Specialist Site for Journalism” category at the Online Media Awards.
-