
This is part 2 of a three part series. See here for part 1 and part 3.
We have one really good tool for predicting the rate of growth of solar. It exists because, in 1933, the US government asked for flying cars.
In 1933, Gene Vidal, head of the U.S. Bureau of Air Commerce, announced his vision for a “People’s Airplane.” Powered by a Ford engine and targeted to cost only $700 – the price of a Pontiac – this plane would open up air travel to the masses. To spur innovation, his Bureau offered a competition to US aircraft manufacturers: It would award two grants to subsidize production of an aircraft that could meet this cost target, at a production run of 10,000 planes.

The Hammond Model Y, winner of a grant for the “People’s Airplane”. Image: Smithsonian
Any engineer knows that the costs of manufacturing a product – aircraft or otherwise – go down as the volume goes up. Labor becomes proficient over time, as workers implement simple changes such as optimizing the position of a piece in need of welding. As production rises, companies invest in tooling, which simplifies assembly further. Materials are also purchased more cheaply as logistics become streamlined – delivery from a full truck costs less than delivery from a half truck; deliver by train costs less still.
But how cheaply could 10,000 planes be made?
For aircraft companies, the opportunity was both riveting and lunatic. For comparison, the Boeing 247 was released in 1933 as the first modern commercial aircraft, with a production run of 60 planes, at a unit price of $65,000. Ten thousand was more aircraft than had ever been produced for any model, military or civilian.
Was such a price possible? Could an assembly line be built? And how on earth should a company estimate the costs of 10,000 planes, when an order of 100 planes represented work beyond the dreams of any reasonable production manager?
To use modern terminology, airplane companies had no idea how to scale. No one had ever taken a leap of this sort. There was no template to work from.
Into this abyss stepped Theodore Paul Wright, chief engineer of the airplane division of the Curtiss-Wright Corporation. Ted was the black sheep of an absurdly distinguished family: His father, Phillip, was a professor, inventor of a statistical technique that is still applied today. His eldest brother, Sewell, made key mathematical contributions to the modern synthesis of genetics and evolution. His middle brother, Quincy, co-founded the first International Relations program at a US university, and became the leading scholar of war of his generation.
But Ted was a doer, not an intellectual. While at MIT during WWI, he joined the Navy, and became an aircraft inspector. After the war a naval career became a dead-end, so Ted applied for work as an engineer at the Curtiss Aircraft Company.
Yet Ted shared in his family’s genetic bounty. By age 30, Ted was running the company’s engineering division. And by 1933, with a decade of experience leading design and build teams, Ted possessed reams of data on plane production and cost.
When the request came to quote costs for 10,000 planes, Ted had an idea of what to do. He charted airplane costs against volume for the numbers that he had, on logarithmic paper. And he drew a line.
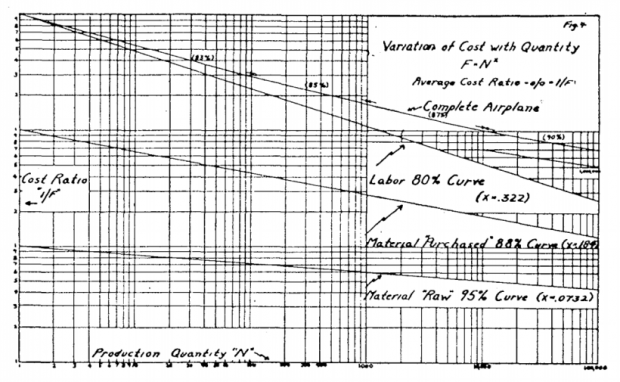
From “Factors Affecting the Cost of Airplanes“, TP Wright, Journal of the Aeronautical Sciences 3(4), 1936
What he found – later published in 1936 – was that the costs of both supplies and finished goods fell with astonishing regularity as production increased. With every doubling of the number of units produced, the cost of labor dropped by 20% (an “80% curve”, above). The cost of purchased materials dropped by 12%. The cost of raw materials fell by 5%. And the cost of a completed airplane – itself a combination of labor, supplies, and raw material – dropped by 13%.
With this relationship, predictions that would seem to require a crystal ball morph into a problem solved by middle school math.
To find out the cost of 10,000 planes, all Wright would need is the cost of the first unit, and the slope of the line. And he plotted this out, he saw that if a plane drops in costs by 13% per doubling – it’s called an “87% curve” in the graph – a production run of 10,000 planes will be 1/10th the price of the first. If you need the price in production to be $700, you had better be able to build a single unit for $7,000. If you can’t, don’t bother trying.
The Curtiss-Wright Corporation never made a flying car. Instead, it learned how to predict the future.
The experience curve
For those familiar with modern technology, Wright’s Law might sound strangely similar to Moore’s Law, which stated that the number of transistors on a computer chip would double every two years. It too is plotted on a logarithmic graph, but it’s plotted against time instead of volume. And it too emerged remarkably straight.
In fact, you can reformulate Moore’s Law to plot the price of a transistor versus total production, or the price of transistors versus time, and both show up as a lines as well.
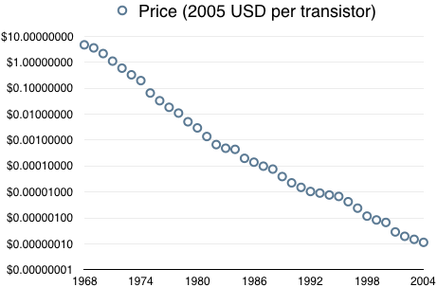
Moore’s Law, plotted as cost versus time. Original data set from the Santa Fe Institute’s Performance Curve Database
Prices fall over time, as production rises. And generally speaking, this is remarkably predictable – Moore’s Law and Wright’s Law are effectively the same thing, and apply to nearly every product, from transistors to airplanes to polystyrene to beer. Prices fall at different rates – semiconductor prices have dropped much faster than beer prices – but in every case when you plot price on a logarithmic scale versus time, you get a line.
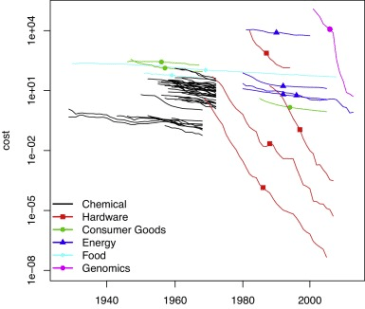
Image from How Predictable Is Technological Progress?, JD Farmer and F Lafond, Research Policy 45(3), 2016
Applying one simple rule, you can predict the future. And the simple rule works great, right up until it doesn’t.
Why predicting solar has been so hard
“Images have been released showing the sheer size of a new solar power plant in southern India. The facility in Kamuthi, Tamil Nadu, has a capacity of 648 MW and covers an area of 10 sq km. This makes it the largest solar power plant at a single location, taking the title from the Topaz Solar Farm in California, which has a capacity of 550 MW.”
Al Jazeera, Nov 30, 2016
“Built at a cost of about 6bn yuan (£721.3m) and in almost constant expansion since construction began in 2013, Longyangxia now has the capacity to produce a massive 850MW of power – enough to supply up to 200,000 households – and stands on the front line of a global photovoltaic revolution being spearheaded by a country that is also the world’s greatest polluter.”
The Guardian, January 17th, 2017
Gordon Moore has always been clear that the steady rate of improvement of semiconductors was not from some natural principle. Carver Mead, a professor of engineering who became one of the earliest proponents of Moore’s Law, summarized the engine of Moore’s Law succinctly: Belief.
“It’s not a law of physics, it’s about human belief, and when people believe in something, they’ll put energy behind it to make it come to pass… So here’s an example where Gordon [Moore], when he made this observation early on, he really gave us permission to believe that it would keep going. And so some of us went off and did some calculations about it and said, ‘Yes, it can keep going’. And that then gave other people permission to believe it could keep going. And [after believing it] for the last two or three generations, ‘maybe I can believe it for a couple more, even though I can’t see how to get there’ “
Prof. Carver Mead
A shared belief creates tremendous advantage – even with the field moving fast, if semiconductor manufacturers believe, then suppliers feel secure making long term investments in technology, and their costs and capabilities conform. Semiconductor customers feel secure designing products that require high power chips to thrive, so users for these new chips arrive just in time.
To call this belief is not to compare it to bloodletting, or homeopathy, or sprites. You cannot achieve lower manufacturing costs through the powers of positive thinking.
This belief is about certainty, about a benevolent form of industrial collusion. It’s a common frame of reference that lets even ruthlessly competitive industry move in lock step. A shared belief in the future – a belief firmly rooted in the real – benefits all.
But what happens when there is no coordination? What happens when not everyone believes?
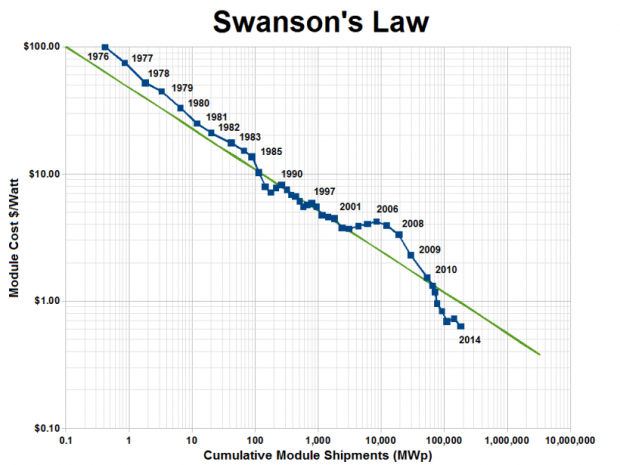
Swanson’s Law, showing the relationship between module prices and the total produced over all time. Image: Wikipedia.
Swanson’s Law is the name given to these same price and volume trends by the solar industry. But Swanson has not been so lucky.
Solar prices followed a simple decline from 1979 through 2003; save for a few minor glitches, the industry behaved exactly as it should. But in 2004, expectations for prices hit a bump. And the reason why was simple: Disbelief.
In 2004, the price of a solar module was about $4/W, about ten times what it is today. Solar was a niche business, serving hippies living in mountain cabins and Polynesian islanders who could not get electricity any other way. It was totally uneconomical for anyone with a connection to the grid. But by 2000, rising concerns about global warming – most notably in Germany, where a “feed-in tariff” subsidized the cost of solar – led people, business, and governments to buy solar anyway.
This came as a shock to makers of high purity silicon, who had previously viewed solar as an afterthought to their main market, in semiconductors. The solar industry tried to warn silicon producers that demand was going to continue its increase. The silicon producers did not believe.
It takes 24-36 months to build a new silicon plant. As demand grew, there was a shortage of silicon, and prices rose for years before renewing their march downward in 2008.
But then something even weirder happened. Solar prices fell below their long term trend. By a lot.
Technology + belief = progress
The price of solar modules can fall for many reasons. Suppliers learn to purify silicon using less energy, and drop their prices. Panel manufactures learn to handle thinner wafers, which use less material. The simple act of scaling, with improved automation and logistics, drops prices further.
After 2008, solar manufacturers gained a new weapon in their battle against costs: Silicon makers built large plants to serve solar alone, and looked with new focus at how they could tune these plants to cut solar’s costs. And because, as Wright taught us, the rate of reduction for a product’s price is just the average of the rates for all of its components, that alone should have put solar on a sharper downward trend.
But the reason that got most of the attention of the industry – and politicians – was the simplest story: Solar manufacturers started to sell modules near, or below, cost.
In political circles, this practice is called “dumping”. When the companies doing the dumping are getting government subsidies, it’s considered an unfair trade practice because it forces competitors in less generous regimes out of the marketplace. And because most of the world’s solar manufacturing is in China, there is little question that these companies are getting some sort of generous treatment.
However, there can also be good, non-political reasons to sell at or below cost. The best modern example is Amazon, which for twenty years has barely booked a profit. Amazon’s investors tolerate this because the market for on-line retail is vast, and scale brings lower costs. Because consumers follow cost, the company who scales fastest wins the largest market share. Which gives the revenue needed to scale more still. A short term restraint turns, over time, into an insurmountable advantage.
LCD television makers did this in the mid-2000s – prices were dropping steadily at 20% per year, as boxy cathode ray TVs were slowly replaced by high end, flat panel displays. Finally, large-screen televisions reached a price point accessible for the average consumer. And consumers responded, in droves.
To keep up with market demand required billion-dollar investment in next-generation factories; to fill the factories required more market share. LCD companies did the only thing that made sense – they dropped prices by 35% per year instead. If you ever wondered what happened to the plasma and projection televisions that competed with LCD in 2004, this is the story. The LCD makers scaled first, lowered prices to fill their factories, and drove their competitors out of the business.
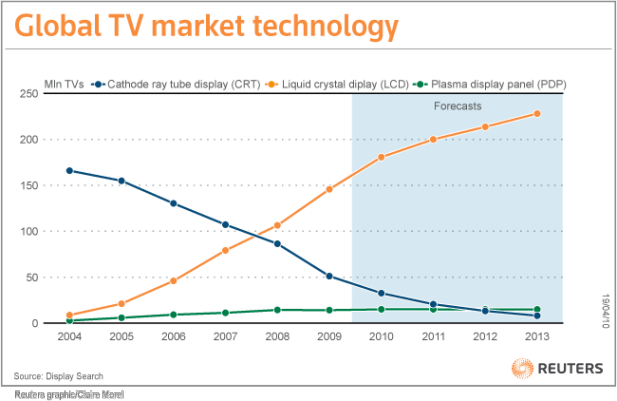
A 2009 Reuters summary of the TV market. In 2004, things did not look so bad for plasma TVs. Five years later, it was game over.
And so it is in solar.
Solar has reached the tipping where demand is no longer sustained by government fiat, where investment will soon be an order of magnitude larger than in the past. And only companies that make that leap – companies that lower their prices to keep their market share, and invest every possible penny in cutting costs for the future – will survive.
Experts who looked at market trends in the early 2000s missed the bump that was caused by suppliers not believing. And they missed the drop today, caused by the solar panel companies themselves believing their time has finally arrived.
Now it’s time for all of us to believe.
How big could solar get? Big enough to impact my electricity bill? Big enough to save the climate?
Originally published by Perspicacity.xyz
-

By: Seth
Seth lives in Longmont, Colorado and works as a technology innovation consultant. He has a Ph.D. in chemistry from Caltech, which he got in order to satisfy a long-standing itch to understand how the world works. But it’s probably just as useful to know that he has a bachelors from a really good liberal arts college, has co-founded several startups, and has over 80 issued US patents in a bunch of different fields, from energy storage to medical devices to software.
-